IPO Investment:Good or Bad?
Aug 10, 2024There has been growing interest in India regarding IPOs. While some vocal critics point to the lack of profitability among Indian unicorn startups, this hasn’t deterred people from enthusiastically applying for IPO allotments. The subscription numbers of some of the hottest recent IPOs, such as Zomato, PayTM, Nykaa, and Ola Electric, clearly reflect this trend.
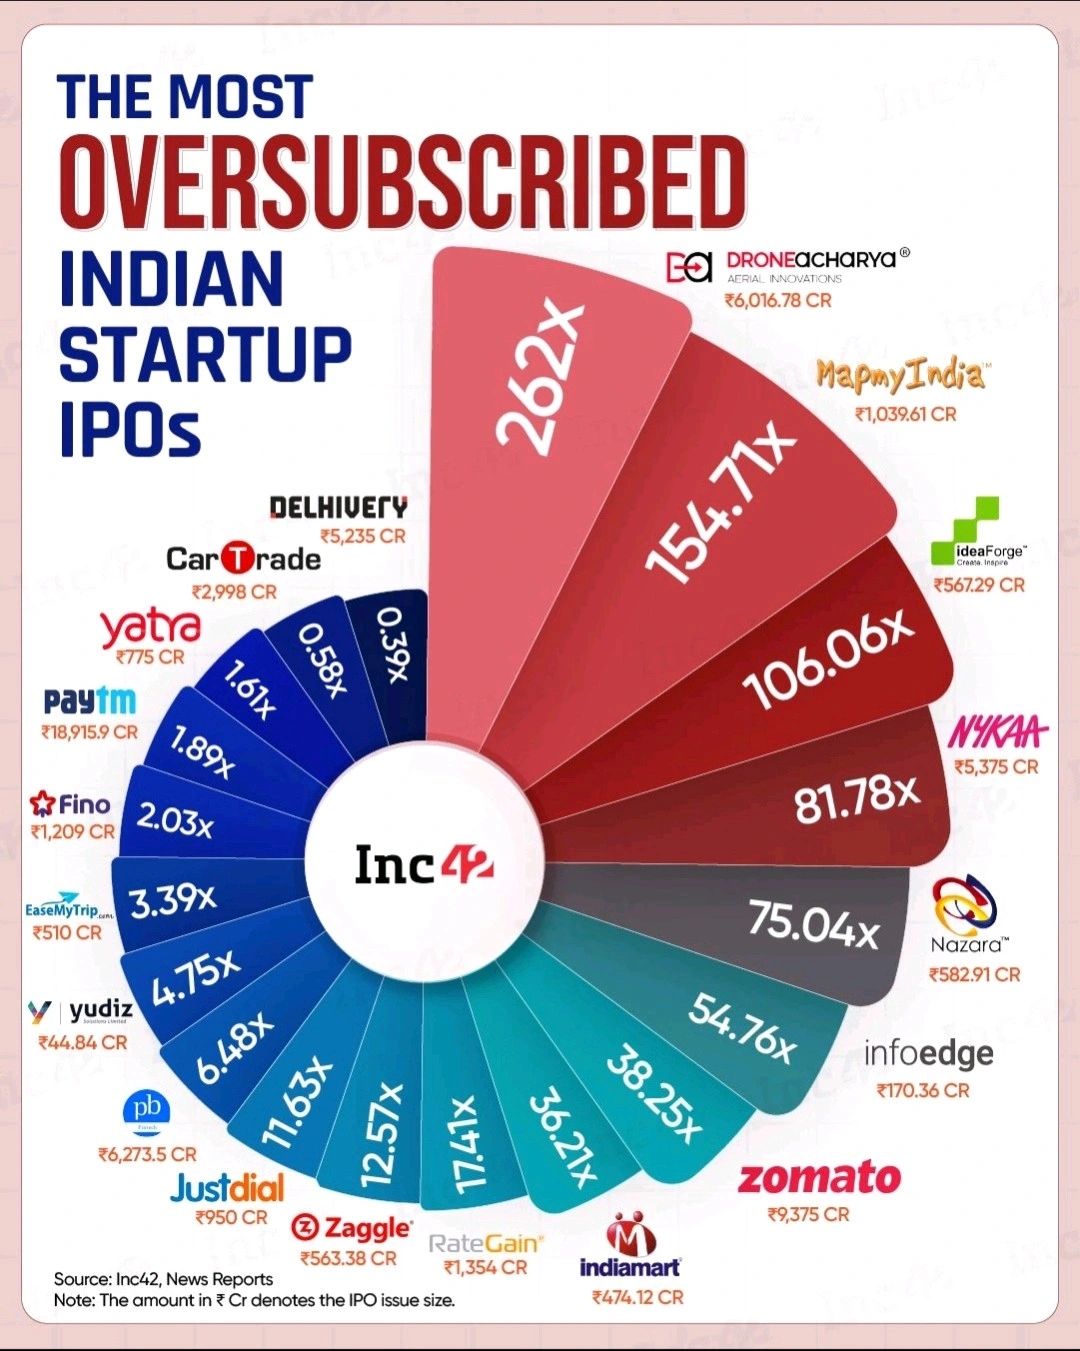
Here is a great infographic from Inc42 about the most oversubscribed IPOs of India.
So, the million-dollar question (sometimes literally) is: Is investing in IPOs worth it?
Caveat
Before proceeding any further with this post, I want to highlight the following caveats:
-
The information provided is for general informational purposes only and should not be considered financial advice. Always consult with a qualified financial advisor before making any investment decisions.
-
The following analysis is intended for Retail Investors (RIIs). Investment strategies for Qualified Institutional Buyers (QIBs) and Non-Institutional Investors (NIIs) are (literally) above my pay grade. The analysis is strictly from the perspective of an RII.
A good place to start the analysis is by understanding why someone might apply for an IPO allotment. Generally, IPO participants can be classified into two categories:
Investors:
- Believe in the company’s potential.
- Aim to get in on the ground floor of a stock that could grow multifold in the coming years.
- Early investors in an IPO can benefit from significant price increases once the stock starts trading on the market. If the company performs well, the value of shares can rise quickly, offering substantial returns.
- Investment Horizon: At least 1-3 years.
Traders:
- Seek to earn a quick buck through listing gains.
- Plan to book profits on the listing day and exit the position immediately.
- Investment Horizon: Typically <1 week
I had heard a lot about the mythical returns associated with IPOs. However, I struggled to find substantial data backing these claims. Most articles in financial news outlets offer a generic warning about the risks associated with IPOs, but I was more interested in cold, hard facts rather than wishy-washy advice.
So, I decided to perform an analysis.
Methodology
Over the past 3-4 years, we’ve witnessed a bull run in the stock market, accompanied by a surge of new retail investors entering the market, eager to make quick profits. To ensure that my analysis isn’t skewed by this recent market frenzy, I decided to examine IPOs from a broader time frame—specifically, from 2008 to 2024, covering about 17 years.
I believe 17 years is a sufficiently long period, encompassing various bull and bear market conditions, to provide a balanced and unbiased analysis.
I also aimed to base the analysis on the behavior of a rational retail investor—someone with a basic understanding of IPOs and stocks, but not necessarily a finance professional.
One of the first things any rational investor should consider is the offering size. If the offering size is less than ₹100 crore, the company typically falls into the SME category. A reasonable investor would (or at least should) avoid these companies, as they are often more susceptible to insider trading and low-volume trading.
I have analyzed the IPOs with Issue Size > 100 Cr.
Classification of Returns
My final, and potentially controversial, assumption concerns how to classify the quality of returns from an IPO compared to other investment vehicles, such as government bonds, equities, index funds, etc. While many attributes can be used for comparison, I will focus on the two most important: Expected Return and Risk.
Let’s rank stock investments in order of risk, from low to high.
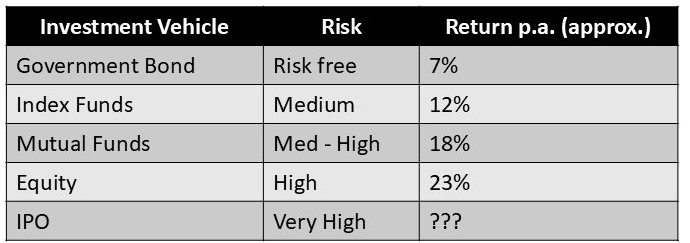
As any good investor knows, the higher the risk, the higher the expected return.
When a company goes public and is newly listed on the stock market, it faces several risks. Its future is uncertain, there’s a lack of historical financial data, and the stock may be overvalued. Investing in an IPO is often riskier than investing in established companies.
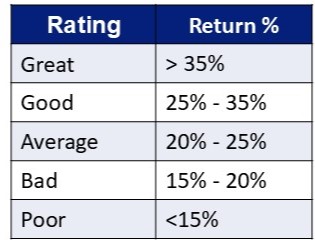
Therefore, it is reasonable to expect a return of at least 25% for it to be considered a decent investment.
Based on this assumption, here are how I would rate the performance of an IPO.
Now that we have set the baseline for analysis, let’s get started.
Returns for Investors
As we’ve discussed earlier, an investor who applies for an IPO allotment truly believes in the company and its growth story. They want to get in on the ground floor because they genuinely believe this company’s stock will be a multi-bagger, and they are willing to hold the stock for at least 1-3 years. But is their belief truly warranted? Let’s see what the data says.
Between 2008 and 2024, a whopping 1,643 companies filed for an IPO. Of these, 1,168 companies had an issue size of less than ₹100 crore. Since these are SMEs, retail investors generally tend to avoid them. That leaves us with approximately 475 companies. Out of these 475 companies, around 39 have been delisted, and we can also exclude them from consideration.
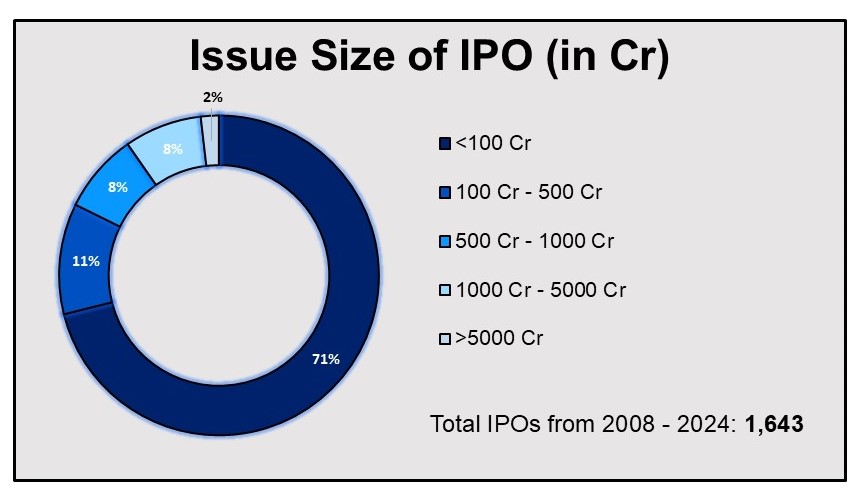
So, we are left with 436 companies currently listed on the stock market. These 436 companies had an issue size > 100 Cr with around 30 companies having an issue size > 5,000 Cr.
Here are the results of analyzing the 436 companies.
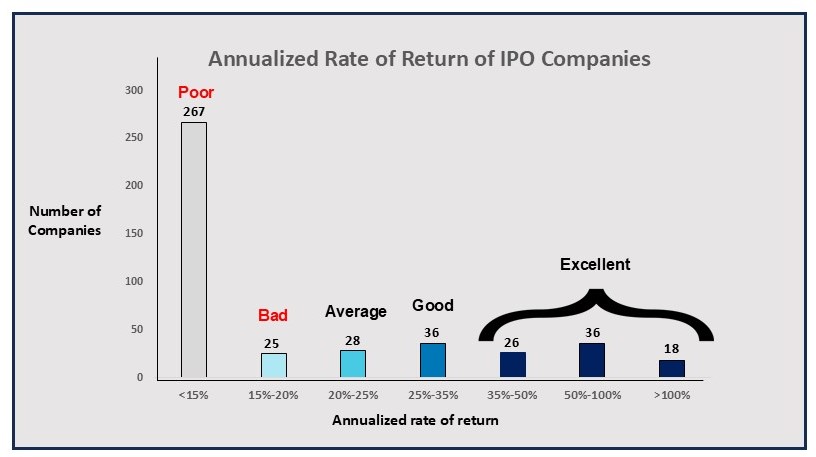

Average Annualized Rate of Return = 16.85%
Out of 463 IPOs, over 320 companies had a below average return (<25%). That is, roughly 75% or 3 out of 4 IPOs fail to give any meaningful returns.
Moreover, the average annualized rate of return, at 16.85%, is significantly low considering the risks involved, placing it firmly in the ‘Bad’ category on our rating scale.
Given these factors, I believe that long-term investing in IPOs is NOT worth the risk.
Returns for Traders
While it’s clear that IPOs may not be ideal for long-term investments, what about listing gains? Given the shorter time horizon for these investments (1-3 days), it’s somewhat acceptable even if the gains aren’t substantial.
Can investors count on an IPO company’s shares always rising above the issue price, providing a straightforward profit to traders?
Let’s analyze this further.
Leaving aside the gain %, let’s look at how many IPO companies had listing price > offer price.
To increase the number of companies for analysis, I had considered the companies listed in 2007 - 2024. I also considered the delisted companies also, as some of these surprisingly had significantly high listing price at their onset. This brings our total companies to analyze to 503.
If Listing Price > Offer Price: Successful IPO
If Listing Price < Offer Price: Failed IPO
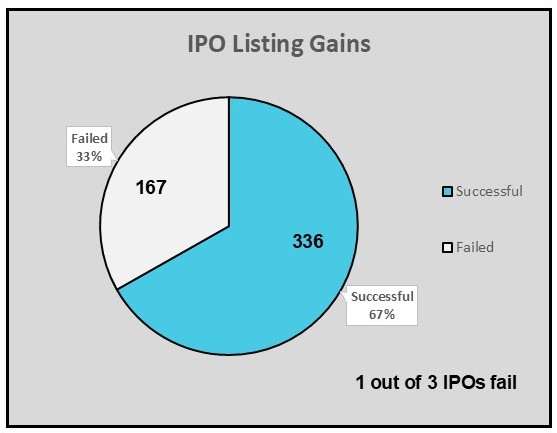
We see that roughly 33% of the IPOs fail, a very high number.
Average Listing Gain = 18.93%
Average Listing Gain after Short Term Capital Gain Tax (20%) = 15.14%
The average listing gains are quite low to make any significant amount of money.
On top of this, for an oversubscribed IPO, the allotment is based on lottery and allot shares to the applicant. Also, a maximum of 1 Lot is allotted per applicant. A lot is the minimal amount of stock that can be bought in an IPO.
Due to the small lot size, even if an applicant is allotted shares in a popular IPO, the listing gains are often modest.
For example, consider Ola Electric. Its offer price was ₹76. It settled at ₹91.18 on the listing day, a 19.9% increase.
The minimum lot size was 195 shares, resulting in a total profit of:
= ₹15.18 * 195 = ₹2,960.10
Profit after STCG = ₹2,368.08
While this isn’t a bad return, it’s not a game-changer in terms of trading gains.
In conclusion, while IPOs may attract significant interest, the data suggests that they are not a reliable investment strategy for either long-term investors or short-term traders. The risks and modest returns do not justify the hype surrounding them.
P.S.: This quote from The Intelligent Investor by Benjamin Graham has always resonated with me. It was true back in 1949 when the book was released and seems just as relevant today:
“Weighing the evidence objectively, the intelligent investor should conclude that IPO does not stand only for ‘initial public offering.’ More accurately, it is also shorthand for: It’s Probably Overpriced, Imaginary Profits Only, Insiders’ Private Opportunity, or Idiotic, Preposterous, and Outrageous.”